 As we close out 2015, we are reviewing the results we obtained from the perpetual covered call strategy during the past year. In terms of total return as tracked in the monthly spreadsheets, the average across all positions was 44.2% during 2015. In the past year ending 12/17, the S&P 500 only returned 0.73% and the DJIA returned 0.76%. Therefore, we beat the market significantly and generated significantly more income. The average monthly income across our open positions was $145 for each position with 100 stock shares!
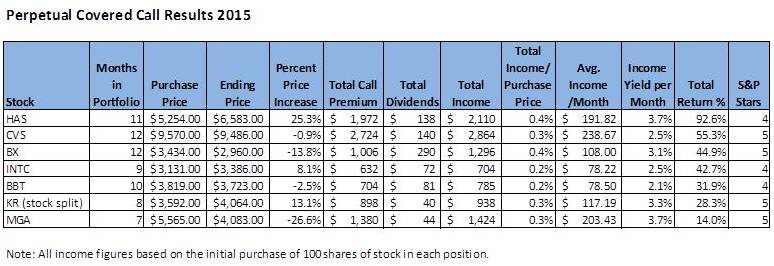
The table below shows the results for each perpetual covered call position during 2015. This table is the same information as displayed in the monthly tables for each position (based on owning 100 shares of stock and selling one covered call each month). Note Kroger stock split during the year as shown in the table.
Compared to the market averages, all of our perpetual covered call positions finished above the market. We had 2 positions with returns above 50% – HAS and CVS. Interestingly, the average price increase was only 0.4%! This clearly shows we make our returns based on monthly premiums and dividends. This indicates this strategy can make money in a side and downward trending market.
As we start 2016, we will share a new list of perpetual covered call trades. We will add to these as the year proceeds forward with new trades based on what happens in the market.
If you have any open puts, they will need to be closed out. We will be starting with new protective puts for each position we have open and start throughout the year. To lower the cost, we will be buying puts that are long-dated for Jan 2017. This will provide protection throughout the year and allow investors to allocate the put cost over more months.