The year 2016 was another stellar year of total returns and monthly income. Our perpetual covered call strategy was a big winner. In this strategy, we create a covered call position to sell monthly call options for income and buy a long dated put option to protect our downside risk. The put cost is spread across several months so the cost is low per month and will only slightly diminish our monthly income.
As we close out 2016 and reset for 2017, we are reviewing the results we obtained from the perpetual covered call strategy during the past year. In terms of total return as tracked in the monthly spreadsheets, the average across all positions was 27.8% during 2016. In the past year ending 12/17, the S&P 500 only returned 12.75% and the DJIA returned 16.8%. Therefore, we more than doubled the S&P and beat the Dow Jones significantly while generated significantly more income. The average monthly income across our open positions was $152 for each position with 100 stock shares! AND this includes the cost of having a long put to protect against downside risk on each position.
The average cost of 100 shares across all positions was $5,278 which generated an average of $152 of income each month. A $50K portfolio will generate an average of $1500 per month while a $100K portfolio creates $3,000 every month! This is proof our income strategy works. We target a 2-3% return per month on average.
We had no losing positions in our perpetual call portfolio in 2016. We had 3 positions with returns greater than 40%and all but one with returns greater than 12.7% of the S&P 500 in 2015.
The table below shows the results for each perpetual covered call position during 2016. This table is the same information as displayed in the monthly tables for each position (based on owning 100 shares of stock and selling one covered call each month). This is for portfolio tracking only as subscribers will own more than 100 shares and sell like size amount of call options for income each month.
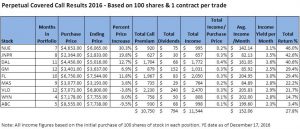
Click to enlarge chart