The year 2017 was another great year of total returns and monthly income. We had a call yield of 21% for our portfolio. You can’t get this level of yield from a dividend payment.
In terms of total return as tracked in the monthly spreadsheets, the average across all positions was 37% during 2017. In the past year ending 12/15, the S&P 500 only returned 20%. Therefore, we almost doubled the S&P while capturing significant alpha return. The average monthly income across our open positions was $132 for each position with 100 stock shares. If you own all positions (100 shares) you would capture $953 dollars of income per month. And if you double up you can capture $2,000 per month. You get it – $4,000 per month is achievable.
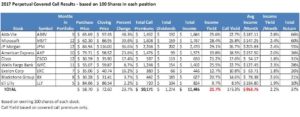
We had no losing positions in our perpetual call portfolio in 2017. We had 8 of 9 positions with returns greater than 20% and all but one with returns greater than 20% of the S&P 500 in 2017.
The table below shows the results for each perpetual covered call position during 2017. This table is the same information as displayed in the monthly tables for each position (based on owning 100 shares of stock and selling one covered call each month). This is for portfolio tracking only as subscribers will own more than 100 shares and sell like size amount of call options for income each month.